Founder-Led Marketing Metrics That Matter: What to Track Beyond Impressions and Likes

Vanity metrics like likes and impressions don’t pay the bills. If you're a founder leading your own marketing, stop chasing numbers that look good but don’t drive revenue. Instead, focus on metrics that connect directly to growth and profitability.
Here’s what actually matters:
- Customer Acquisition Cost (CAC): How much does it really cost to land a new customer?
- Customer Lifetime Value (CLV): How much profit will a customer bring over time?
- Return on Marketing Investment (ROMI): Are your marketing dollars pulling their weight?
- Lead Quality: Are your leads converting, or are you wasting time?
- Retention Metrics: Keeping customers is cheaper than finding new ones.
The key? Track data that ties every marketing effort to revenue. Forget vanity stats and focus on what moves the needle. CAC rising? Your channels might be saturated. CLV dropping? Time to fix retention. Marketing isn’t just about activity - it’s about results.
Let’s dive into the metrics that show what’s working, what’s not, and how to grow smarter.
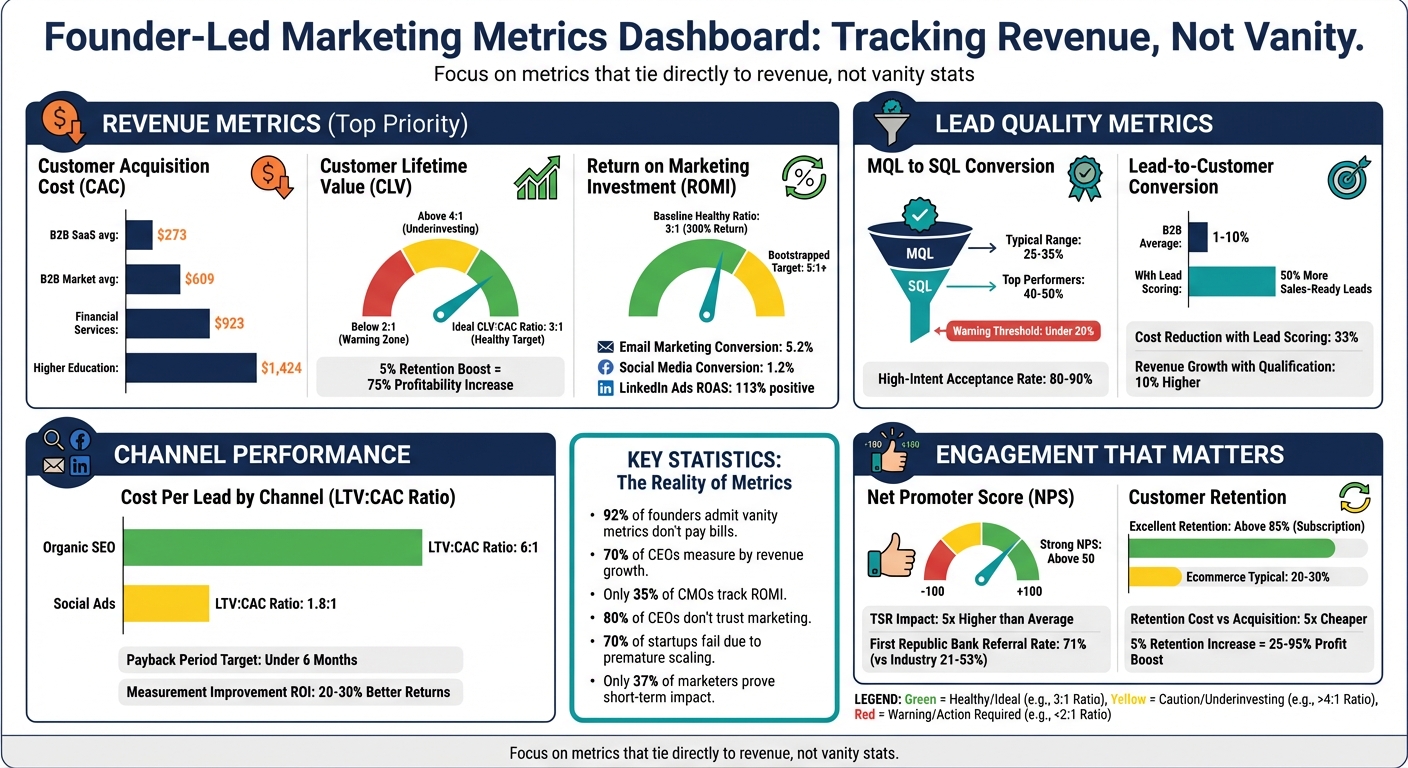
Key Marketing Metrics for Founders: CAC, CLV, and ROMI Benchmarks
The 7 Marketing Metrics Every B2B Leader Should Report On
sbb-itb-9354cf2
Revenue Metrics Every Founder Should Track
When it comes to understanding how your marketing efforts impact income, a few key metrics stand out: Customer Acquisition Cost (CAC), Customer Lifetime Value (CLV), and Return on Marketing Investment (ROMI). These aren't just numbers - they're the backbone of effective decision-making.
Customer Acquisition Cost (CAC)
CAC is the cost of turning potential leads into paying customers. It’s more than just ad spend or software fees; it includes everything from salaries to commissions and even the value of your time. For instance, if you’re spending 20 hours a week on sales calls or networking on LinkedIn, that time has a real cost, even if it doesn’t show up in your bank statements.
To calculate CAC, divide your total sales and marketing expenses over a specific period by the number of new customers you gained during that time. Make sure you include all relevant costs: salaries, software subscriptions, ad budgets, and even a dollar value for your personal time.
"Know your numbers is good guidance for any founder, but some numbers matter more than others. Customer acquisition cost (CAC) is one of the few numbers your startup relies upon for success - or failure."
- Alex Sventeckis, HubSpot
Here’s some perspective: B2B SaaS companies average a CAC of $273, while the broader B2B market sits at $609. Financial services companies spend around $923 per customer, and higher education institutions can go as high as $1,424. But the absolute number isn’t as important as the trend. A rising CAC could mean your channels are getting saturated or your product-market fit is weakening. On the flip side, a falling CAC often signals better efficiency.
Timing is everything. If your sales cycle takes 60 days, don’t compare this month’s new customers to this month’s ad spend - look back two months to get an accurate picture. Also, break down CAC by channel. Whether it’s LinkedIn ads, word-of-mouth referrals, or cold outreach, this approach helps you see which efforts are worth scaling and which ones are draining resources.
"A startup can grow revenue, raise capital, and even look successful externally while a broken CAC quietly erodes margins and shortens runway."
- Lior Ronen, Finro Financial Consulting
Customer Lifetime Value (CLV)
CLV is all about understanding the long-term profitability of a customer. It’s the total net profit you expect to earn from a customer over the course of your relationship. This metric determines how much you can afford to spend on acquiring new customers. For example, if your average customer generates $120 in profit, spending $100 to acquire them leaves you with a razor-thin margin for other costs.
The standard benchmark for CLV-to-CAC ratio is 3:1. If you’re below 2:1, it’s time to pull back on acquisition and focus on retaining existing customers. On the other hand, if your ratio is above 4:1 or 5:1, you might not be investing enough in growth opportunities.
Retention is a game-changer. A 5% boost in customer retention can increase profitability by 75%. Similarly, improving annual retention from 70% to 80% can drive a 51% increase in lifetime value. Breaking down CLV by acquisition channel can also reveal which sources bring in the most profitable customers. For subscription-based businesses, encouraging annual billing can lock in a minimum one-year CLV and improve cash flow.
"CLV and CAC are two of the most important business metrics. To achieve profitability and long-term success, a business' CLV must exceed CAC."
- Bruce Hogan, CEO of SoftwarePundit
That said, 73% of e-commerce companies admit they struggle with accurate CLV calculations. But getting this right is essential - it validates your acquisition costs and supports your long-term revenue goals.
Return on Marketing Investment (ROMI)
ROMI connects your marketing spend to the revenue it generates, making it a critical metric for proving marketing’s value. The formula is straightforward:
(Sales Generated – Marketing Expenses) ÷ Marketing Expenses.
For example, if you spend $10,000 on a LinkedIn campaign and it brings in $40,000 in revenue, your ROMI is ($40,000 – $10,000) ÷ $10,000 = 3:1, or a 300% return. A 3:1 ratio is often seen as the baseline for healthy scaling, but many bootstrapped companies aim for 5:1 or higher.
To get an accurate ROMI, include all marketing costs - ad spend, vendor fees, payroll, and even the value of your time. Tools like CRM systems integrated with ad platforms and accounting software can help you track the entire journey from ad click to closed revenue.
It’s also essential to measure ROMI at the channel level. In 2025, email marketing had a 5.2% conversion rate compared to just 1.2% for social media, and LinkedIn Ads delivered a 113% positive ROAS. These insights can help you decide where to allocate your budget.
Interestingly, while 70% of CEOs measure marketing success by revenue growth, only 35% of CMOs track ROMI. This disconnect often leads to marketing being undervalued. By tying every marketing dollar to revenue outcomes, ROMI helps bridge this gap and positions marketing as a driver of growth.
Finally, align your ROMI measurement with your sales cycle. If your deals typically take six months to close, evaluating a campaign after 30 days won’t give you the full picture. For longer B2B cycles, you might need a full year of data to assess performance accurately.
Lead Quality and Conversion Metrics
Lead quality and conversion metrics give you a clear picture of why your revenue numbers look the way they do. These metrics show if your marketing efforts are pulling in the right audience and whether those leads are turning into paying customers. Ignoring these indicators could mean wasting resources on leads that never close. Let's dive into how metrics like MQLs and SQOs fuel your sales process.
Marketing Qualified Leads (MQLs) and Sales Qualified Opportunities (SQOs)
An MQL represents someone who matches your ideal customer profile and shows genuine interest by actions like visiting your pricing page, downloading resources, or attending webinars. An SQL (or SQO) goes a step further - this is a lead that your sales team has vetted and deemed ready for serious discussions about buying.
This distinction is critical because not all leads are equal. For example, someone downloading a top-of-funnel ebook isn’t the same as someone requesting a demo. In B2B SaaS, MQL-to-SQL conversion rates typically range between 25% and 35%, while top-performing companies hit 40% to 50%. If your rate is under 20%, it’s a sign that your targeting or lead scoring might need some tweaks.
To refine lead quality, use a combination of lead scoring (measuring engagement like email clicks or page visits) and lead grading (assessing fit based on factors like job role or company size). Scoring reflects intent, while grading ensures the lead aligns with your ideal customer profile, giving you a well-rounded view of lead quality.
Negative scoring can help weed out poor-quality leads by deducting points for disqualifying signals like student email addresses [47,49]. You can also use score decay, where a lead’s score resets if they haven’t engaged in 90 days, ensuring your sales team focuses on leads with current intent.
Speed matters. High-intent leads - those requesting demos or pricing - should hit an 80% to 90% sales acceptance rate. If you’re below that, it could mean your criteria are too broad or your sales team isn’t responding promptly. Automate lead routing to ensure MQLs are assigned to the right rep immediately, and enforce a Service Level Agreement (SLA) requiring sales to accept or reject leads within 24 hours.
One company, for example, boosted its MQL-to-SAL acceptance rate from 68% to 90% in just two quarters by introducing segment-based thresholds and mandatory follow-ups.
Lead-to-Customer Conversion Rate
Beyond lead qualification, conversion rates measure how effective your sales process is. This metric answers a straightforward question: how many of your leads actually become paying customers? To calculate it, divide the number of new customers by the total number of leads generated in the same period. For B2B companies, this number usually falls between 1% and 10%.
In March 2025, Bob Ruffolo, CEO of IMPACT, used a "work backward" method to secure 15 new Mastery clients. His team figured out they needed 25 proposals, which required 40 qualified sales opportunities and 100 initial sales meetings. This approach shifted the marketing team’s focus from just driving traffic to generating meaningful sales appointments.
"Marketing's job isn't just to generate leads, but to generate leads that will close."
- Bob Ruffolo, CEO, IMPACT
Just like customer acquisition cost (CAC) trends can guide strategic decisions, lead velocity reveals how healthy your sales funnel is. Lead velocity measures how quickly leads move through each stage of the funnel. High-quality leads tend to convert faster. If your MQL-to-SQL conversion time is dragging beyond 14–30 days, it might point to slow nurturing or misaligned targeting.
To improve conversion rates, prioritize speed-to-lead - respond to demo requests within minutes, not hours. Faster response times almost always lead to better MQL-to-SQL conversion rates [42,37]. Another tactic is lead recycling: instead of discarding disqualified leads, add them to a nurture sequence so they’re ready when the timing is right.
Use self-reported attribution on forms to capture influences like word-of-mouth, mentions in private Slack groups, or podcasts - things automated systems might miss. Companies with formal lead qualification processes see 10% higher revenue growth, and implementing lead scoring can generate 50% more sales-ready leads while cutting costs by 33%.
Campaign and Channel Performance Metrics
To make smart decisions about where to invest your marketing budget, you need to track more than just surface-level metrics. It’s about identifying campaigns that drive revenue and cutting the ones that waste resources. By digging into the numbers, you can figure out which channels attract loyal customers and which ones are just burning through your cash.
Cost Per Lead (CPL) and Traffic Source Analysis
Not all leads are created equal - some cost more, and some deliver more value. That’s why understanding Blended CAC (total sales and marketing costs divided by all new customers) and Paid CAC (media spend plus agency fees divided by customers from paid channels) is so important. While a solid Blended CAC might look good, it can hide the fact that a paid channel isn’t pulling its weight.
Take the time to track your entire funnel by channel, from Marketing Qualified Lead (MQL) to Sales Qualified Lead (SQL) to Opportunity to Closed Won. For example, email marketing often converts at 5.2%, while social media averages only 1.2%. Organic SEO tends to deliver an impressive LTV:CAC ratio of about 6:1, compared to social ads at just 1.8:1. These stats prove that volume alone doesn’t tell the whole story.
"Think of every marketing campaign as an experiment... You should know, without guesswork, if it is working."
- Tate Stone, RevBlack
To get clarity on what’s working, set up a Marketing Taxonomy and consistently use UTM parameters for all links. Tagging links in your ads, emails, and social posts with Source, Medium, and Campaign tags lets you pinpoint where your traffic is coming from.
Dive deeper by creating a cost matrix that breaks down performance by channel and customer segment (like SMB, mid-market, or enterprise). This can reveal insights like LinkedIn being a strong performer for enterprise leads but a poor choice for SMBs. To optimize for actual revenue, connect ad clicks directly to closed deals in your CRM using GCLID-to-CRM tracking. Keep in mind, only 37% of marketers can prove the short-term impact of their spend, but those who excel at measurement see returns improve by 20–30%.
Another key metric is your Payback Period - how many months it takes to recover customer acquisition costs. Top-performing SaaS companies aim for under six months. If it’s taking longer than 6–12 months, it’s a red flag that your spending might outpace your earnings.
And don’t forget to include indirect costs, like the 20 hours a week you might spend creating content, in your CAC calculations. Underestimating these costs can lead to scaling decisions that backfire.
These insights help you see how efficiently and quickly your channels convert leads into paying customers.
Sales Cycle Length
Sales cycle length measures how long it takes to turn a lead into a paying customer, starting from the first touchpoint. This metric directly affects how fast you can recover CAC and start generating profit. A shorter cycle means quicker revenue and better cash flow.
Use tools like HubSpot or Salesforce to track how long leads spend at each stage of the funnel. For instance, the average MQL-to-SQL conversion rate is about 13%. If your process takes longer than expected, it could mean you’re targeting the wrong audience or creating unnecessary friction.
Pay attention to how many touchpoints it takes to convert a customer. A lengthy path might signal issues like a confusing pricing page or a demo request form that asks for too much information. Plus, remember that 53% of mobile users will abandon a site if it takes more than three seconds to load.
Segment your sales cycle data by channel and customer type. SMB deals usually close faster than enterprise deals, which involve more stakeholders. Without proper segmentation, you risk making poor funding decisions based on incomplete data.
To speed things up, target high-intent prospects with competitor conquesting campaigns. These ads focus on searches like "[Competitor] alternatives", capturing buyers already in decision-making mode. This approach can cut your cost-per-lead by about 30% and often results in faster funnel movement.
Another useful tool is the Assist Index, which helps you credit channels that contribute to conversions but don’t get the final click. For example, a podcast might introduce a prospect to your brand, but they convert later through a retargeting ad. Ignoring those early touchpoints undervalues their role in the sale.
Finally, monitor your Lead Velocity Rate - the month-over-month growth of qualified leads. This forward-looking metric gives you a heads-up on pipeline health before deals close, helping you spot and fix issues early.
Engagement Metrics That Actually Matter
When it comes to founder-led marketing, measuring engagement isn’t just about counting likes or impressions. Sure, those numbers might feel good in the moment, but they don’t necessarily translate into revenue or loyalty. The real question to ask is: does this metric give insight into revenue potential and customer retention? To build trust and long-term relationships, you need to focus on metrics that truly matter.
Net Promoter Score (NPS) and Customer Retention
The Net Promoter Score (NPS) is a key tool for gauging customer loyalty. It measures how likely customers are to recommend your brand, using a scale from 0 to 10. Those who score 9 or 10 are your Promoters - your biggest supporters who drive word-of-mouth growth. An NPS above 50 is considered strong, and companies with high NPS scores often see a median total shareholder return that’s five times higher than the U.S. average for large public firms.
"Financials can easily tell us when we have extracted $1 million from our customers' wallets, but they can't tell us when our work has improved customers' lives."
- Fred Reichheld, Creator of the Net Promoter System
Customer Retention Rate (CRR) is another critical metric. It shows the percentage of customers who stick with your business over time. For subscription-based companies, retention rates above 85% are excellent, while ecommerce businesses typically see rates between 20% and 30%. Retention isn’t just about keeping customers; it’s about profitability. A 5% increase in retention can lead to 25% to 95% higher profits, and acquiring new customers costs five times more than retaining existing ones.
To make the most of these metrics, track NPS regularly - monthly or quarterly - to spot trends instead of relying on one-off data points. When running retention campaigns, try using a 10–20% holdout group to measure their true impact. Segmenting retention data by cohort (e.g., signup month) can also help you see how specific updates or campaigns resonate with users [15,63].
A great example of retention in action comes from First Republic Bank. In 2021, 82% of its deposit growth and 88% of its loan growth came from existing customers and their referrals. Even more impressive, 71% of new customers came through referrals - far above the industry average of 21% to 53%.
While loyalty metrics are essential, understanding the effectiveness of direct communication is just as important.
Email Performance Metrics
It’s easy to obsess over email open rates, but they don’t tell the full story. What really matters is whether your emails inspire action. Metrics like Click-to-Open Rate (CTOR) and conversion rates reveal if your emails are driving meaningful engagement.
Revenue per Subscriber is another key indicator. It helps you determine whether your email list is filled with active buyers or just passive readers. To get real-time feedback, automate NPS or Customer Satisfaction (CSAT) surveys after key moments - like a first purchase or the resolution of a support ticket. This can help you capture customer sentiment when it’s fresh. Keep in mind, a single bad experience can drive 52% of customers to a competitor.
Quality Social Media Engagement
Social media metrics can be tricky. Vanity metrics like follower counts or likes might look impressive, but they don’t always reflect meaningful engagement. Instead, focus on metrics that show intent. Shares indicate endorsement, Saves show your content is worth revisiting, and thoughtful Comments suggest genuine interaction.
"I learned that virality is not and should never be the goal of social media. A good tap in the shoulder for the ego does not equal business success."
- Meryoli Arias, Head of Social Media, Glide
When analyzing social media performance, prioritize Shares and Saves over likes. Use social listening tools to gauge brand sentiment by categorizing mentions as positive, negative, or neutral. This helps you understand the emotional connection customers have with your brand. As you create content, ask yourself: Why would anyone care enough to stop scrolling? If you don’t have a good answer, your content might not be hitting the mark.
To tie social engagement back to revenue, break down interactions by customer demographics and traffic sources. This can help you identify which groups are most engaged and likely to convert. The ultimate goal isn’t to go viral - it’s to build a community that trusts your brand, buys from you, and becomes your advocate.
How to Build Your Metrics Tracking System
Now that you’ve identified the metrics that fuel growth, it’s time to create a system to track them effectively. The aim isn’t to track everything under the sun - it’s to build a straightforward, repeatable process that helps you make quicker, smarter decisions.
Select Your Core Metrics
Start by aligning your metrics with your company’s goals. For example, if your target is to "increase market share by 15%", break it down into actionable outcomes like "generate 40% more qualified leads". Then, connect your metrics to each stage of the customer journey: Awareness, Engagement, Conversion, Revenue, and Retention.
Stick to 5–10 metrics that truly matter. Tracking too many creates noise, making it harder to focus on what drives decisions. Prioritize metrics like CAC (Customer Acquisition Cost), LTV (Lifetime Value), and churn rate over vanity stats such as page views or follower counts. If a metric hasn’t impacted a business decision in the last month, consider shelving it. It’s worth noting that 70% of startups fail due to premature scaling, often caused by poor metric discipline.
"If you have more than 3 priorities, you don't have any priorities."
Consistency is key. Use a UTM naming convention (Source, Medium, Campaign) to standardize data across platforms. This helps identify which channels are driving conversions. Also, make sure your CAC calculations align with the finance team’s definitions so the data holds up in executive discussions.
Once your core metrics are set, establish a routine for reviewing them to keep everything actionable.
Set Up Regular Review Schedules
Operational metrics need weekly reviews; strategic ones should be checked monthly. Daily reviews are helpful for spotting technical issues - like a sudden drop in traffic or leads - but monthly reviews provide a better view of long-term trends. Weekly reviews help you tweak ongoing campaigns, while quarterly reviews allow you to reassess and adjust your broader goals.
Assign one person to consistently update your dashboard. When multiple people input data, errors and omissions are almost guaranteed. To simplify performance tracking, use a "Red, Yellow, Green" system: Green means you’re on track, Yellow signals a warning, and Red demands immediate action.
Keep review meetings brief and focused. If a metric is performing as expected, move on. If it’s underperforming, the responsible person should explain why and commit to a specific action before the next review. Run quarterly "sniff tests" to eliminate outdated metrics and adjust for seasonal shifts.
These regular reviews pave the way for integrating your marketing metrics with sales data.
Link Marketing Metrics to Sales Data
Create a unified dashboard that everyone - finance, growth, and sales - trusts. This eliminates debates over data accuracy and ensures a single source of truth. Use GCLID-to-CRM tracking to directly link ad clicks to closed revenue.
Track "influenced pipeline", which measures the total revenue impacted by marketing efforts, to demonstrate how marketing drives sales outcomes. Multi-touch attribution is another must-have, as it credits all marketing touchpoints in the customer journey - not just the first or last click. Also, ensure marketing and sales agree on what defines an MQL (Marketing Qualified Lead) versus an SQL (Sales Qualified Lead) so both teams stay aligned on revenue goals.
Dig deeper into CAC by breaking it down by channel instead of relying on a blended figure. This reveals how long it takes to recover acquisition costs for each channel, helping you decide where to invest more. Save UTM parameters at the moment of signup so that source data follows the lead into your CRM. Meet weekly with sales and marketing leads to review fast-moving metrics like CAC trends and new monthly recurring revenue (MRR), allowing for timely adjustments.
"Marketing performance is often presented through activity-based wins... Yet when leadership asks how much revenue marketing generated, the connection between effort and outcome is frequently unclear."
Start simple. Use a spreadsheet for 2–3 quarters before committing to expensive dashboard software. This approach helps you identify the metrics that genuinely matter. The 80/20 rule applies here: leadership can get 80% of the insights by focusing on the top 3 metrics for each business function during a monthly review.
Conclusion
This guide has broken down the metrics that truly drive marketing success, going far beyond surface-level numbers. By focusing on revenue, conversion, and engagement metrics, it's clear that data-backed decisions are the foundation of sustained growth. The distinction between chasing vanity metrics and tracking meaningful business outcomes can make or break your trajectory. Interestingly, 92% of startup founders admit that vanity metrics - like likes and impressions - don’t pay the bills. Yet, these metrics remain popular because they’re easy to measure and deliver quick hits of validation.
Focusing on key metrics like CAC, LTV, conversion rates, NPS, and other revenue indicators allows for faster experimentation, smarter learning, and actionable insights. When you prioritize what matters, you steer clear of wasting resources on "budget vampires" - campaigns that may boost traffic but fail to attract valuable customers. These metrics don’t just guide strategy; they enable you to act decisively and effectively.
"Although vanity metrics offer momentary satisfaction, they don't contribute to your bottom line."
The hard truth? There’s often a disconnect between CEOs and CMOs when it comes to defining marketing success. While 70% of CEOs evaluate marketing based on revenue growth, only 35% of CMOs track this critical metric. This misalignment explains why 80% of CEOs lack trust in marketing efforts. To close this gap, tie every campaign directly to pipeline impact and revenue. Doing so not only builds trust but also ensures marketing plays a strategic role in driving the business forward.
FAQs
What costs should I include in CAC?
Include every expense connected to your sales and marketing activities. This includes advertising costs, salaries for your sales and marketing team, agency fees, and creative production costs for paid channels. Don’t forget to factor in any other direct expenses tied to bringing in new customers. Together, these numbers form your customer acquisition cost (CAC), a key metric that helps you gauge how effectively your marketing dollars are working.
How do I calculate CLV if I’m early-stage?
To figure out Customer Lifetime Value (CLV) for an early-stage startup, start by estimating the average revenue a customer will bring in over the course of their relationship with your business. Pay attention to key elements like retention rates and profit margins. Since early-stage startups often lack extensive data, rely on simplified models built around initial customer behavior and reasonable assumptions. As you gather more data over time, revisit and fine-tune these estimates for greater accuracy.
How can I tie marketing to revenue with a long sales cycle?
To connect marketing efforts to revenue during lengthy sales cycles, it's essential to use metrics and attribution models that reflect marketing's influence over time. Prioritize account-level tracking, multi-touch attribution, and lookback windows that match the duration of your sales cycle. Keep a close eye on critical metrics such as Customer Acquisition Cost (CAC), Lifetime Value (LTV), and conversion rates. These will help pinpoint successful strategies and demonstrate how marketing drives revenue throughout the extended sales process.