The Metrics Rhythm: What VPs Should Review Weekly vs Monthly

Here’s the deal: If you’re a VP, drowning in data or missing critical issues until it’s too late is a recipe for disaster. The fix? Review the right metrics at the right time.
- Weekly metrics are your early warning system. They help you spot issues fast so you can fix them before they snowball. Think MQLs, SQLs, pipeline growth, and lead acceptance rates.
- Monthly metrics reveal long-term trends. These include CAC, ROMI, and lead-to-opportunity conversion rates - perfect for strategic decision-making.
Why it matters: Teams with structured reviews hit 70–80% of their goals. Without them? Just 30%. The key is aligning your review cadence with your team’s ability to act.
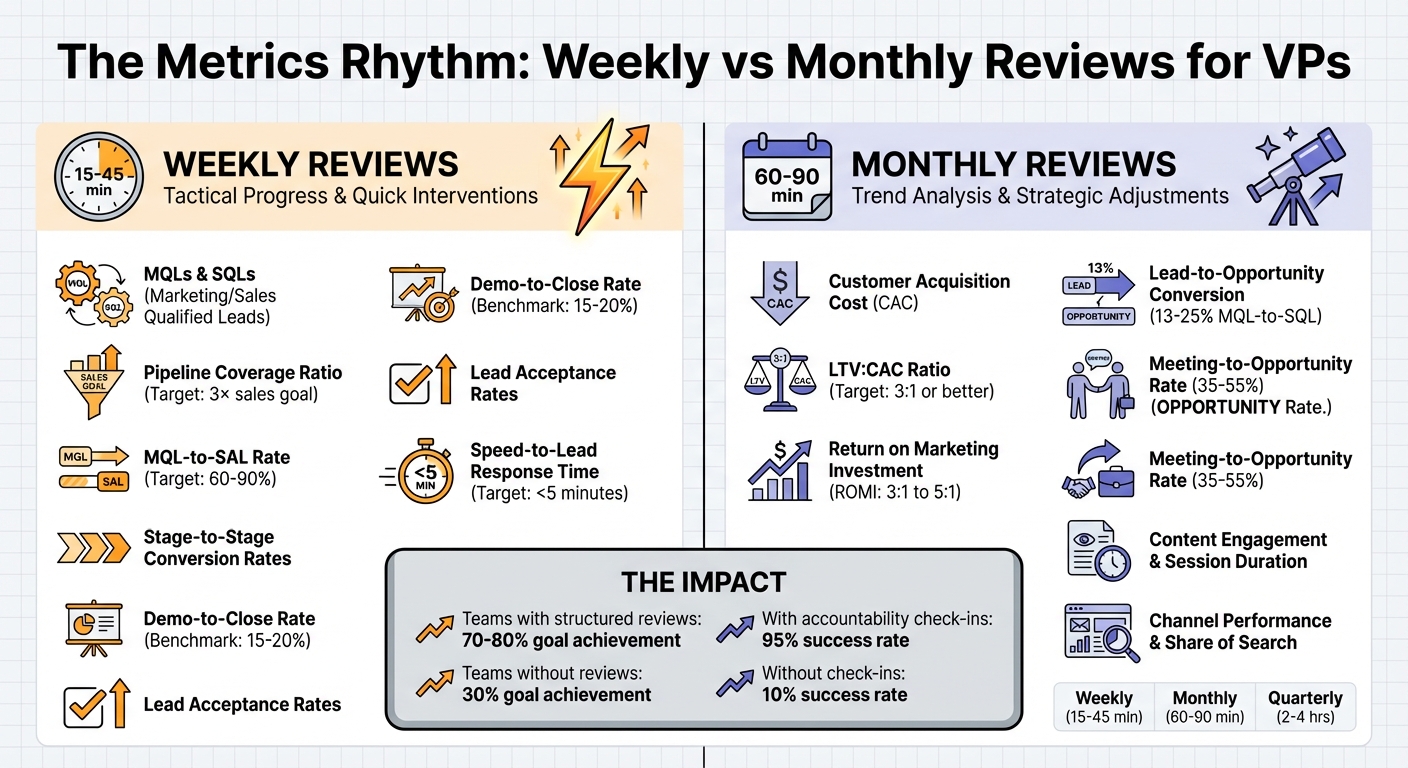
Weekly vs Monthly Metrics Review Cadence for VPs
VendorVibes Whiteboard Lesson: Reporting Cadence for Marketing Intelligence
sbb-itb-9354cf2
Weekly Metrics: Tracking Day-to-Day Performance
Weekly metrics are like an early warning system - they won’t always explain why something’s off, but they’ll show you where to start digging. These indicators shift quickly enough to demand attention without the noise of daily fluctuations. The aim? Spot problems early so there’s still time to fix them before the month ends.
MQLs, SQLs, and Pipeline Growth
To keep tabs on potential issues, focus on lead and pipeline metrics.
Marketing Qualified Leads (MQLs) and Sales Qualified Leads (SQLs) are crucial weekly benchmarks. MQLs represent prospects showing enough interest, while SQLs are leads that sales has vetted and deemed ready for a deeper conversation.
The transition from marketing to sales is a pivotal moment. Your MQL-to-SAL (Sales Accepted Lead) rate measures how often sales agrees with marketing’s definition of a qualified lead. A well-aligned team sees this rate between 60% and 90%. If it dips below 50%, it’s a red flag for misalignment, which can waste resources and frustrate both teams.
Another essential metric is the pipeline coverage ratio. Aim for at least 3× your sales target in qualified pipeline (e.g., a $100,000 target requires $300,000 in pipeline). Tracking this weekly lets you spot gaps early, adjust outbound efforts, and shift budgets toward channels that are performing better. These adjustments help refine your monthly evaluations.
Interestingly, teams tracking 5–7 core KPIs hit 91% of their quotas, compared to just 73% for those tracking fewer metrics.
Stage-to-Stage Conversion Rates
Watching how deals move through each stage highlights bottlenecks. For example, if 100 leads reach the discovery stage but only 20 make it to proposal, there’s likely a snag in your process.
The demo-to-close conversion rate is a key benchmark, typically landing around 15–20%. That’s about one closed deal for every four to six demos. If your numbers are lower, dig into specific stages. For instance, a strong discovery-to-proposal rate but a weak proposal-to-negotiation rate might point to pricing issues, competitive challenges, or trouble aligning with key decision-makers.
"Stage conversion rates reveal exactly where your pipeline leaks."
Companies that monitor SQL performance metrics see a 28% boost in win rates and 33% more accurate revenue forecasts. A weekly review allows you to act mid-cycle - whether it’s reallocating SDR efforts, tweaking messaging, or offering targeted coaching. This ensures issues don’t linger until the end of the month.
Also, flag any deal that drags on for more than 1.5× your average sales cycle length. It’s often a sign of a stalled process or an overly optimistic forecast.
Lead Acceptance Rates
Beyond conversion rates, lead acceptance offers another layer of insight into lead quality.
Lead acceptance rate measures how often sales accepts leads from marketing. High rejection rates might mean the target criteria are off, or leads are being passed along too soon.
Speed is just as critical. Top-performing sales teams respond to inbound leads in under five minutes, and 35–50% of deals go to the rep who responds first. Tracking response times weekly ensures no qualified lead slips through the cracks.
Set Service Level Agreements (SLAs) for lead handoffs, and act fast if response times lag. Regular reviews keep everyone accountable, making it easier to correct course when acceptance rates drop or response times slow down.
Liam Bartholomew, Global Head of Demand Generation at Cognism, sums it up well:
"An SQO is a sales rep, saying, 'I think this could close,' and you want to be generating as many of those as possible."
Monthly Metrics: Understanding Long-Term Patterns
Weekly metrics are great for catching immediate issues, but monthly metrics help you see the bigger picture. They offer a broader view of how well your strategies are working, giving you the chance to spot trends and make meaningful adjustments. By looking at monthly data, you can identify deeper patterns that weekly snapshots might miss.
Customer Acquisition Cost (CAC) and Return on Marketing Investment (ROMI)
Customer Acquisition Cost (CAC) helps you measure how much you're spending to gain each new customer. To calculate it, divide your total sales and marketing expenses by the number of new customers. Be sure to include everything - team salaries, tools, creative costs, and sales commissions - and ensure these numbers match your financial records.
The trend of your CAC matters more than the actual number. If your CAC keeps rising month after month while your lead volume stays the same, it could mean your leads are lower quality or your sales process is becoming less effective. For B2B SaaS companies, a good benchmark is an LTV:CAC ratio of 3:1 or better, meaning every dollar spent on acquiring a customer should generate three dollars in revenue.
Return on Marketing Investment (ROMI) measures how much revenue your marketing efforts are bringing in. The formula is straightforward: (Attributed Revenue - Marketing Spend) / Marketing Spend. Growth-stage B2B companies often aim for ROMI ratios between 3:1 and 5:1 over a 12–18 month payback period. As Bryan Philips from In Motion Marketing explains:
"The difference between marketing as a 'cost centre' and marketing as a 'revenue engine' comes down to which metrics matter in your boardroom."
Break these metrics down by channel - paid ads, content, events - rather than looking at totals. This way, you can see which specific efforts are becoming more or less efficient over time. Tools like cohort analysis and MER (Blended ROAS) can help you spot trends, with MER identifying inefficiencies even when individual channels appear to perform well.
Once you've evaluated cost efficiency, shift your attention to how well leads are converting into real sales opportunities.
Lead-to-Opportunity Conversion Rates
A high volume of leads only matters if they turn into real sales opportunities. Lead-to-Opportunity conversion rates help you understand whether your marketing is bringing in the right audience or just generating noise.
Typical MQL-to-SQL conversion rates fall between 13% and 25%, while a healthy Meeting-to-Opportunity conversion rate ranges from 35% to 55%. If your rates are below these benchmarks, you might have a targeting issue - attracting the wrong audience - or your lead scoring criteria might be too loose.
Monthly reviews give you enough data to identify these patterns without being misled by weekly fluctuations. Dive into conversion rates by source - organic search, paid ads, or referrals - to see which channels consistently deliver qualified prospects. Leads from lower-intent sources, like content downloads, can take 20% to 30% longer to close compared to inbound opportunities from your ideal customer profile (ICP).
Top-performing B2B companies aim for 30% to 60% of their pipeline to come directly from marketing efforts. If you're not hitting that target, monthly conversion analysis can pinpoint where things are breaking down. Once you’ve assessed conversion efficiency, take a closer look at how content and channels are driving long-term engagement.
Content Engagement and Channel Performance
Metrics like average session duration and engagement rate show whether people find your content valuable. As Sean Francis from Blue Magnet Interactive puts it:
"Marketing is about positioning products and services in front of potential customers and traffic (sessions, new users) is the lynchpin of everything. If no one is reading your brilliant copy, then your brilliant copy isn't doing its job."
Break down traffic sources - organic, branded, or referral - to understand which efforts are delivering the most value. For example, separate searches for your company name from broader, category-specific searches. This distinction helps you evaluate the effectiveness of SEO efforts (unbranded) versus brand-building campaigns (branded).
Don’t just focus on last-click attribution. Use Assisted Conversions reports to identify channels that play a supportive role in the buyer's journey, even if they’re not the final step before conversion. Some channels might not close deals directly but could still shorten your sales cycle or improve close rates.
Another useful metric is Share of Search - your branded search volume divided by the total category search volume. It’s a strong indicator of brand health and market share when tracked over a rolling 12-month period.
Monthly reviews also help catch technical issues that could harm conversions. For instance, 53% of mobile visitors will abandon a site if a page takes longer than three seconds to load. While Core Web Vitals might seem like a technical detail, they directly affect whether your content engagement leads to pipeline growth.
Compare performance month-over-month and year-over-year to account for seasonal trends. A February dip might be normal for your industry, but a similar drop during your peak season could signal a serious issue. These monthly insights fit into your broader review process, helping you refine your quarterly strategies.
How to Build Your Metrics Review Schedule
Creating a metrics review schedule involves organizing your reviews into four levels: weekly for quick fixes, monthly for spotting trends, quarterly for adjusting strategies, and annually for long-term planning. This structured cadence helps teams stay focused and aligned.
Start by establishing a single, shared scorecard with clear metric definitions and a data dictionary. This avoids confusion and ensures everyone is on the same page. Research shows that structured review processes lead to higher success rates - organizations with regular reviews achieve goal completion rates of 70% to 80%, compared to just 30% for those without. Moreover, individuals who schedule accountability check-ins are 95% more likely to hit their goals versus only 10% for those who skip reviews entirely.
Let’s break down how to implement daily, weekly, and monthly reviews to keep teams in sync and responsive.
Daily and Weekly Checks
Weekly reviews, lasting 15 to 45 minutes, are all about quick interventions. These sessions aren’t for deep dives but to spot issues early and act fast. Focus on metrics that demand immediate attention, like pipeline coverage, speed-to-lead response times, MQL volume, or cash position. Think of these metrics as “smoke detectors,” as RevOps leader Mark Hudson puts it:
"Tactical metrics are 'smoke detectors.' They don't tell you why revenue is off, but they tell you where to look".
For example, if your speed-to-lead suddenly jumps from two hours to eight hours, you need to act immediately - no need to wait for a monthly review.
To make these meetings efficient, send out automated dashboards 24–48 hours beforehand. This allows team members to come prepared, turning the meeting into a decision-making session rather than a status update. Set up alerts for critical SLA breaches, like lead response times exceeding targets, so you can address issues mid-cycle.
Use consistent time windows (e.g., Last 7 Days or Quarter-to-Date) to ensure accurate comparisons across reviews. Keep your focus tight - monitor about seven key metrics to avoid overwhelming the team with too much data.
Once immediate concerns are handled, shift your focus to monthly reviews for a broader analysis of trends.
Monthly Reviews and Adjustments
Monthly Business Reviews (MBRs) typically last 60 to 90 minutes, providing enough time to dive into trends and make tactical adjustments. These sessions are where you analyze win rates, sales cycle lengths, P&L versus budget, and channel ROI. They help uncover patterns that weekly reviews might miss, such as rising customer acquisition costs (CAC) or consistently underperforming lead sources.
Don’t wait for perfect data to hold your monthly reviews. Acting on “good enough” data early in the month is better than delaying action.
Structure these meetings with time-boxed agendas - for example, allocate 10 minutes for reviewing alerts and 20 minutes for discussing blockers. Keep a decision log to track what was decided, who owns the next steps, and deadlines. Publish a changelog summarizing key changes to keep everyone aligned. During these reviews, ask your team for a confidence check - a quick score from 0 to 100% on their ability to hit quarterly targets. A drop in confidence can flag early signs of trouble.
Aligning Teams Around Shared Metrics
Misalignment across teams - like marketing, sales, and finance - can derail even the best plans. The solution isn’t more meetings; it’s ensuring everyone uses the same metrics and definitions. Create a data dictionary that outlines how each metric is calculated (e.g., MQLs vs. SQLs) to eliminate confusion.
Encourage all teams to refer to a single scorecard instead of relying on siloed dashboards. As Scotty Smith, founder of CycleWerx Marketing, explains:
"Consistency beats sophistication every time".
Match your review schedule to the urgency of the metrics. Weekly reviews should focus on metrics that need immediate action, while monthly reviews are better suited for program-level adjustments. Frontline teams need daily or weekly data, while executives benefit from monthly trend summaries. This ensures everyone gets the right insights at the right time.
| Review Tier | Frequency | Focus | Key Metrics |
|---|---|---|---|
| Weekly Operating Review (WOR) | Weekly (15–45 min) | Tactical progress and blocker resolution | Pipeline coverage, speed-to-lead, MQL volume, cash position |
| Monthly Business Review (MBR) | Monthly (60–90 min) | Trend analysis and tactical adjustments | Win rates, sales cycle length, P&L vs. budget, channel ROI |
| Quarterly Strategic Review (QBR) | Quarterly (2–4 hrs) | Strategic planning and investment decisions | CAC:LTV ratio, Net Revenue Retention, market share |
Common Mistakes to Avoid
VPs often stumble into traps that derail effective metrics programs. These missteps waste valuable time, create confusion, and keep teams from focusing on what truly matters. Here's how to sidestep some of the most common pitfalls.
Tracking Too Many Metrics
Overloading on metrics creates a flood of data that buries critical performance issues, leaving teams struggling to identify actionable insights. Worse, tracking a surplus of activity-based metrics can backfire, encouraging reps to game the system - like making calls just to hit targets without actually driving revenue.
Take the example of Michael Torres and his B2B sales team at Prospectory in 2025. They initially tracked 34 metrics, leading to a 62% quota attainment and wasting 45 minutes weekly on "public audits" of data. By slashing their metrics down to seven core KPIs - focusing on leading indicators like pipeline coverage and reply rates for weekly meetings - they shifted efficiency metrics to monthly coaching sessions. Within two quarters, quota attainment surged to 78%. Torres explains:
"Most sales metrics are noise. They make you feel productive without actually changing outcomes. The teams that consistently hit quota aren't tracking more data - they're tracking the right data and acting on it fast".
Here’s a tip: use the 20% Rule. If a 20% change in a metric doesn’t lead to action, drop it. High-performing RevOps teams typically maintain a 3:1 ratio of leading to lagging indicators to stay ahead of issues.
Inconsistent Definitions Between Teams
When marketing celebrates hitting MQL targets while sales complains about declining lead quality, it’s clear there’s a disconnect. As highlighted in the shared scorecard section, having a common data dictionary is critical to bridging these gaps.
Consider this: 89% of companies agree that misalignment between teams directly impacts revenue, yet only 22% use the same KPIs across marketing, sales, and customer success. A legal-tech SaaS company in 2025 faced flat pipeline growth despite higher ad spend. By realigning lead scoring and refining sales trigger alerts, they boosted their MQL-to-SQL conversion rate from 6% to 24% and cut customer acquisition costs by 26% in just four months.
To fix these issues, conduct a metric audit. List every metric used by marketing and sales, along with its data source, owner, and calculation method, to flag duplicates or vague definitions. As Nathan Thompson from Fullcast puts it:
"If a metric does not help a rep, a manager, or finance make a better decision this week, drop it".
Manual Data Updates and Reporting Delays
Manual data entry slows down insights and eats into time that could be spent on revenue-generating activities. By the time these manually updated reports reach leadership, they’re often outdated, making timely interventions nearly impossible. These delays and inconsistencies can wreak havoc on decision-making.
Automating data checks, SLA alerts, and dashboard distribution can save time and ensure VPs have the information they need before meetings - not while scrambling during them. In 2025, a European fintech company found that its automated lead routing had a 15% failure rate, causing delays of 23 hours. By focusing on this specific efficiency metric instead of just tracking outcome volume, they improved their lead-to-opportunity conversion rate by 18%. Companies with centralized data governance see 15% higher forecast accuracy and make decisions 20% faster.
Prioritize quality-adjusted metrics like "qualified pipeline coverage", which focus on deals with high qualification scores. These metrics are three times more predictive of revenue than simple volume metrics. Additionally, using unified pipeline definitions can cut forecast variance from 40% to as low as 12%.
Avoiding these pitfalls is key to building a metrics review process that supports both quick fixes and long-term strategy adjustments.
Conclusion
The gap between VPs who consistently hit their goals and those who fall short often comes down to poorly timed review processes. When your reporting cadence aligns with quick action, lead management evolves into a proactive feedback system that drives results.
Here’s how it works: daily checks help you catch immediate problems, weekly reviews provide a snapshot of funnel performance, and monthly deep dives uncover long-term trends. This isn’t just theory - it’s a proven method for success.
Take this example: a mid-market SaaS company in 2025 adopted daily SLA monitoring and weekly funnel reviews. Within hours, they identified lead routing issues, adjusted SDR coverage mid-week, and saw improved SAL acceptance rates. By the end of the quarter, their pipeline was steady and reliable. Companies with structured review cadences like this hit their goals 70–80% of the time, compared to just 30% for those without regular reviews.
To fine-tune your process, apply the 20% Rule: if a 20% change in a metric doesn’t trigger action, it’s not worth tracking. Build a shared glossary so marketing and sales speak the same language, and automate dashboard delivery so reports are ready 24–48 hours before meetings. These steps ensure every review is efficient and actionable.
The secret isn’t more data - it’s having the right data at the right time. Stick to this framework, commit to your schedule, and watch your team shift from putting out fires to driving revenue with confidence.
FAQs
Which 5–7 metrics should I pick for weekly reviews?
Focusing on 5–7 key metrics during weekly reviews can provide a clear snapshot of your progress and help you stay aligned with your goals. Metrics like lead SLA compliance, pipeline coverage ratio, sales activity levels, customer acquisition cost, pipeline health, win rate, and forecast accuracy are particularly useful. They allow you to monitor short-term performance and make timely adjustments to keep things on track. By zeroing in on these areas, you can ensure that your efforts are both efficient and effective.
What should I do when MQL-to-SAL drops below 50%?
If your MQL-to-SAL conversion rate dips below 50%, it’s time to take a closer look at how leads are being qualified and passed between teams. Start by ensuring that marketing and sales are on the same page with clear, shared definitions of what qualifies as a lead. Misalignment here can create confusion and bottlenecks.
Next, refine your qualification criteria. Are you focusing on the right signals, like engagement levels or firmographics? Tightening up these standards can help ensure only high-potential leads move forward. Finally, strengthen communication between teams to close any gaps in the process. A smoother handoff can make all the difference in boosting conversions.
How do I calculate CAC and ROMI accurately each month?
To figure out your CAC (Customer Acquisition Cost), take the total amount you spend on marketing and sales in a month - this includes things like salaries, software, and campaign costs - and divide it by the number of new customers you brought in during that month.
For ROMI (Return on Marketing Investment), measure how much revenue your marketing efforts generated compared to what you spent on marketing during the same time frame. Make sure to align both these metrics with your sales cycle and check them regularly. This helps you spot trends and fine-tune your strategies as needed.